FEB
06

Midwest propane market more balanced than a year ago

Graph of Midwest (PADD2) propane/propylene inventories, as explained in the article text
Graph of spot prices on an energy-equivalent basis, as explained in the article text
Graph of propane spot prices, as explained in the article text
Graph of propane wholesale and retail prices, as explained in the article text
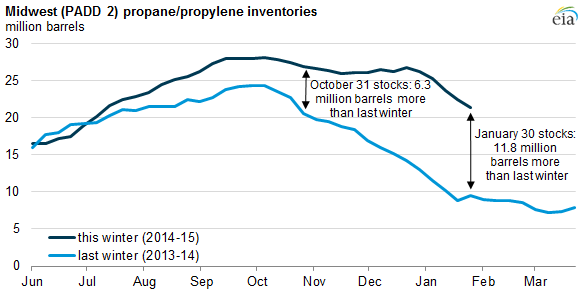
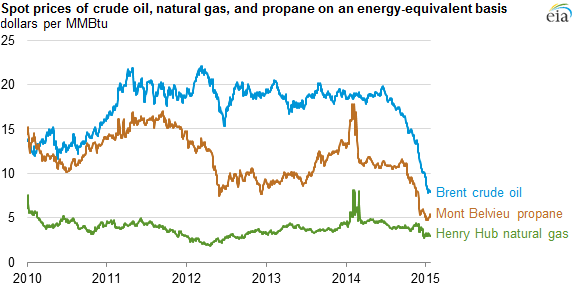
February 6, 2015 Source: U.S. Energy Information Administration, Weekly Petroleum Status Report Higher inventories, milder weather, and falling crude oil and natural gas prices have resulted in a Midwest propane market that so far this winter has not experienced the challenges faced last winter, when the combination of depleted inventories and high winter demand pushed propane prices to record highs . This winter, lower demand as a result of a less-severe winter (Midwest heating degree days so far this winter are 8.5% below the comparable year-ago period) has kept Midwest propane markets well-supplied. Inventories in the region are 11.8 million barrels above the same time last year and 6.3 million barrels more than the five-year average as of January 30. Source: U.S. Energy Information Administration, Thomson Reuters Propane is produced from both natural gas and crude oil—in 2013, about 60% of propane was from natural gas processing,...
Continue reading
  4663 Hits

Copyright

© EIA

4663 Hits
FEB
05

Defense Department energy use falls to lowest level since at least 1975

Graph of Defense Department energy use, as explained in the article text
Graph of DoD energy consumption, as explained in the article text
February 5, 2015 Energy used by the U.S. Department of Defense (DoD) fell to 0.75 quadrillion British thermal units (Btu) in fiscal year (FY) 2013, the lowest recorded level since at least FY 1975, the earliest available data from the U.S. Department of Energy's Federal Energy Management Program (FEMP). DoD accounts for most of the energy consumed by the federal government. The share of federal government energy use attributed to DoD fell from 87% in FY 1975 to 78% in FY 2013—the lowest share on record. Energy usage within DoD is divided into two areas: installation energy and operational energy. Installation energy is the energy required to run and operate military installations, which is mainly energy used in buildings but also energy used by vehicles not on combat missions. Operational energy, which accounts for 70% of total DoD energy use, is the energy required for transporting, training, and sustaining personnel and...
Continue reading
  3043 Hits

Copyright

© EIA

3043 Hits
FEB
04

Energy consumption by U.S. government at lowest level since at least 1975

Graph of federal government energy consumption by type, as explained in the article text
Graph of federal government square footage and energy intensity, as explained in the article text
Graph of federal government energy expenditures and use, as explained in the article text
February 4, 2015 The U.S. federal government, with thousands of facilities and vehicles in locations across the United States and abroad, is one of the largest energy consumers in the world, but that consumption is declining. The U.S. Department of Energy's Federal Energy Management Program (FEMP) shows total delivered-to-site energy use by the federal government fell to 0.96 quadrillion British thermal units (Btu) in fiscal year (FY) 2013, the lowest recorded since 1975, the earliest year for which data are available. In FY 2013, vehicles and equipment energy usage accounted for 62% of all federal energy consumed , with the remainder consumed by federal facilities. The U.S. Department of Defense and the United States Postal Service together accounted for 94% of vehicles and equipment energy usage, which declined 19% from FY 2011 to FY 2013. Much of the decline since 2011 can be attributed to lower consumption of jet fuel, a...
Continue reading
  2973 Hits

Copyright

© EIA

2973 Hits
FEB
03

Increase in average gasoline prices ends 17-week streak of declining prices

Graph of U.S. weekly retail regular gasoline price, as explained in the article text
Graph of Brent crude oil price declines, as explained in the article text
Graph of U.S. weekly retail regular gasoline price by PADD, as explained in the article text
February 3, 2015 EIA conducts a survey of gasoline prices each Monday, and yesterday's survey showed the U.S. average regular retail gasoline price increasing for the first time in 18 weeks. The national price averaged $2.07/gallon on Monday, up 2.4 cents from a week earlier. The steady decline in prices over the previous 17 weeks was the longest consecutive decrease in EIA's weekly survey since prices fell 14 cents per gallon over a 24-week period in 1995. The decline is the largest percentage decline since a 58% drop in gasoline prices over 15 weeks in late 2008. With oil prices at around $45 per barrel (bbl), petroleum refinery outages in the Midwest and Gulf Coast regions in January pushed wholesale spot gasoline prices, and ultimately retail gasoline prices, up at the end of January. Those increases were large enough to raise the national average gasoline price in yesterday's EIA survey ....
Continue reading
  3053 Hits

Copyright

© EIA

3053 Hits
FEB
02

New England generation fuel mix changes likely as Vermont Yankee nuclear plant retires

graph of Vermont Yankee monthly generation, as explained in the article text
graph of New England fuel generation mix, as explained in the article text
graph of ISONE hourly major transmission line interchange with neighboring balancing authorities, as explained in the article text
February 2, 2015 On December 29, 2014, Entergy shut down its Vermont Yankee nuclear facility after 42 years in service. Vermont Yankee had a capacity of 604 megawatts (MW), generating nearly five million megawatthours (MWh) of electricity per year since 2010. As the fifth-largest source of generation in New England, Vermont Yankee accounted for 4% of New England's total electric generation and more than 70% of generation in Vermont. Grid operators in New England have multiple options to replace or offset the loss of generation from Vermont Yankee's closure, and they will most likely use several of them in combination. One option is to operate some of the existing generators in New England at higher rates. The four nuclear units now active in New England—Millstone units 2 and 3 in Connecticut, Pilgrim Nuclear Power Station in Massachusetts, and Seabrook in New Hampshire, with combined summer nameplate capacity of 4,026 MW—already operated...
Continue reading
  2968 Hits

Copyright

© EIA

2968 Hits
JAN
30

Upcoming Super Bowl will be first to be lit with energy-efficient LED lights

image of LED lighting, as explained in the article text
January 30, 2015 Source: Ephesus Lighting Inc., used with permission Before the start of the 2014 NFL regular season, University of Phoenix Stadium in Arizona, home to Super Bowl XLIX, retrofitted 312 high-performance light-emitting diode (LED) stadium light fixtures. The LED fixtures replaced more than 780 metal halide high-intensity discharge (HID) fixtures and will illuminate the field during the Super Bowl on February 1. University of Phoenix Stadium was the first stadium in the NFL to light its playing field using only LEDs. The new lights draw approximately 310 kilowatts of energy compared with the 1,240 kilowatts required by the old system, a savings of about 75%. Assuming an electricity cost of 15 cents per kilowatthour, that means the new LED lighting costs about $47 per hour to light the field, compared to $186 per hour using the HID lighting system. Lighting maintenance costs for LEDs are also expected...
Continue reading
  2839 Hits

Copyright

© EIA

2839 Hits
JAN
27

Hawaii’s electric system is changing with rooftop solar growth and new utility ownership

graph of residential and commercial net-metered solar PV capacity in Hawaii; average residential solar system size, as explained in the article text
renewable watch - Oahu, as explained in the article text
January 27, 2015 Source: U.S. Energy Information Administration, EIA-861 and EIA-826 Note: Average residential solar photovoltaic (PV) system size calculated by dividing total installed capacity by number of meters. HECO , MECO , and HELCO are subsidiaries of Hawaiian Electric Industries Inc.; KIUC is an independent electric cooperative. In December, NextEra Energy Inc. announced an agreement to acquire Hawaiian Electric Industries Inc. , owner of three electric utilities that together supply power to 95% of Hawaii's population. NextEra is one of the largest developers of renewable energy in the United States through its subsidiary NextEra Energy Resources and is also the owner of Florida Power & Light (FPL). While FPL does not rely heavily on solar photovoltaics (PV) and other forms of renewable energy to serve its Florida customers, solar PV already plays a large role in Hawaii, and that role is expected to grow significantly over time. The Hawaiian Electric...
Continue reading
  3542 Hits

Copyright

© EIA

3542 Hits
JAN
26

Lower 48 oil production outlook stable despite expected near-term reduction in rig count

graph of monthly oil production and rig count in the lower 48 states, as explained in the article text
graph of spud-to-completion time for wells drilled in  the Bakken-Three Forks formation, as explained in the article text
January 26, 2015 Source: U.S. Energy Information Administration, January Short-Term Energy Outlook Note: Graph does not include production from Alaska and the Federal Gulf of Mexico. The sharp decline in oil prices over the last quarter of 2014, which has continued in January, is already having a significant effect on drilling activity in the United States, as shown by the 16% decline in the number of active onshore drilling rigs in the Lower 48 states between the weeks ending on October 31, 2014 and January 23, 2015, according to data from Baker-Hughes. Moving from what has happened to forecasting the future is challenging, in part because market expectations of uncertainty in the price outlook have increased as reflected in the current values of futures and options contracts. When the latest edition of EIA's monthly Short-Term Energy Outlook (STEO) was issued on January 13, the 95% confidence interval for market...
Continue reading
  3128 Hits

Copyright

© EIA

3128 Hits
JAN
23

Currency depreciation against the dollar affects oil importers and exporters differently

graph of daily Brent futures price, as explained in the article text
January 23, 2015 Source: U.S. Energy Information Administration, based on Bloomberg Widely traded futures contracts for North Sea Brent crude oil in global financial markets are typically priced in U.S. dollars (USD). The appreciation , or increase in value, of USD against most other currencies since last summer can either mitigate or exacerbate the effects of the recent sharp decline in USD-denominated crude oil prices, depending on whether a particular country is a net importer or a net exporter of crude oil. For example, the price of Brent crude since July 1, 2014, declined by 56% through January 21 in USD. However, given the depreciation of the Indian rupee and Turkish lira against the U.S. dollar over the same period, Brent crude prices in terms of those currencies fell by only 55% and 52%, respectively. Turkish and Indian consumers are therefore experiencing a lesser decline in the cost of...
Continue reading
  2956 Hits

Copyright

© EIA

2956 Hits
JAN
21

EIA updates Eagle Ford maps to provide greater geologic detail

map of initial gas-to-oil ratios of Eagle Ford wells, as described in the article text
map of Eagle Ford play footprint, as described in the article text
map of elevation contours of the top of the Eagle Ford formation, as described in the article text
map of thickness contours of the Eagle Ford formation, as described in the article text
Source: U.S. Energy Information Administration, DrillingInfo, Inc., Texas Natural Resources Information, U.S. Geological Survey, University of Texas Bureau of Economic Geology Recent updates to the Energy Information Administration's maps and geologic information for the Eagle Ford tight oil and shale gas play in Texas help to characterize the formation's structure, thickness, and surface area, as well as the gas-to-oil ratio of its producing wells from January 2000 to June 2014. This information provides a better understanding of recent production within the context of key geologic parameters. The updates can be seen in the following four tabs. The first tab provides additional information on the mix of oil and natural gas hydrocarbons produced by well location. Tabs 2 through 4 provide updated geological information. Source: U.S. Energy Information Administration and Drillinginfo Inc., September 2014 Note: EIA calculates the initial gas-to-oil ratio for each well using the second through...
Continue reading
  4620 Hits

Copyright

© EIA

4620 Hits

Proven Horsepower at ZeroRPM