FEB
25

Wind generation seasonal patterns vary across the United States

graph of monthly median wind plant capacity factors by region, as explained in the article text
graph of monthly median wind plant capacity factors, as explained in the article text
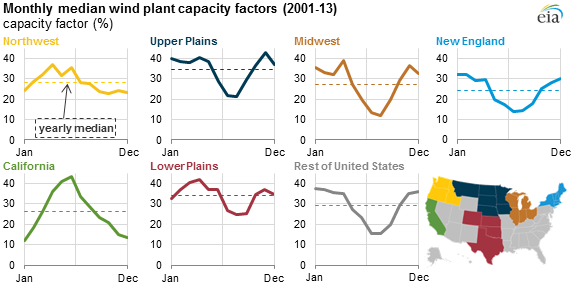
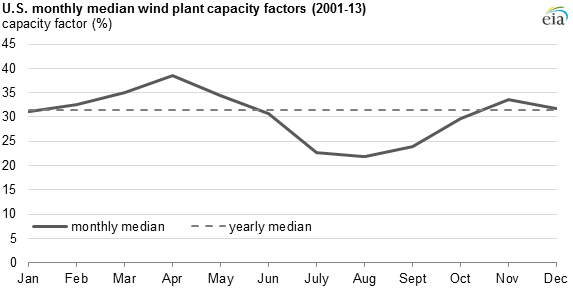
February 25, 2015 Source: U.S. Energy Information Administration, Forms EIA-860 and EIA-923 Note: Data include facilities with a net summer capacity of 1 MW and above only. Wind plant generation performance varies throughout the year as a result of highly seasonal wind patterns. Nationally, wind plant performance tends to be highest during the spring and lowest during the mid- to late summer, while performance during the winter (November through February) is around the annual median. However, this pattern can vary considerably across regions, mostly based on local atmospheric and geographic conditions. Unlike conventional fossil-fueled generators, there is no fuel or other variable cost associated with wind power generation. As a result, a wind plant's capacity factor —a measure of the plant's generation as a percentage of its maximum generating capacity—is very closely related to the available wind resource, or average wind speed. In general, wind plant capacity factors tend...
Continue reading
  3571 Hits

Copyright

© EIA

3571 Hits
FEB
24

Large reduction in distillate fuel sulfur content has only minor effect on energy content

graph of daily spot prices of wholesale gasoline, ethanol, and RINS, as explained in the article text
February 24, 2015 Source: U.S. Energy Information Administration, Petroleum Supply Monthly , Monthly Energy Review Note: Distillate fuel volumes with sulfur content below 15 parts per million produced before 2004 are included in the 'between 15 and 500 ppm' category. Distillate fuel supply for 2014 includes estimated volumes for December 2014 from the Short-Term Energy Outlook, February 2015. Republished February 24, 2015, 9:30 a.m. to correct an error. Distillate fuel oil supply consists primarily of diesel fuel used for transportation and of heating oil burned in furnaces and boilers. Over the past 20 years, the U.S. Environmental Protection Agency (EPA) has regulated the amount of sulfur contained in diesel fuel to enable reductions in harmful emissions of nitrogen oxides and particulate matter from diesel engines . Since 2006, most distillate fuel has had less than 15 parts per million (ppm) of sulfur, a drastic change from the early 1990s, when high-sulfur...
Continue reading
  3241 Hits

Copyright

© EIA

3241 Hits
FEB
23

Higher RIN prices support continued ethanol blending despite lower gasoline prices

graph of daily spot prices of wholesale gasoline, ethanol, and RINS, as explained in the article text
February 23, 2015 Source: U.S. Energy Information Administration, based on Oil Price Information Service, Thomson-Reuters Note: RBOB is reformulated blendstock for oxygenate blending. With the exception of two short periods in late 2013 and the first quarter of 2014, when winter-related logistical bottlenecks drove up ethanol prices , spot ethanol prices have consistently been lower than gasoline prices from December 2011 through October 2014. However, with the sharp decline in crude oil and gasoline prices in the latter months of 2014, gasoline spot prices fell below ethanol spot prices in early November. For most of December through mid-January, ethanol was priced about 30 cents per gallon more than wholesale gasoline; since that time, the gap between the spot prices of ethanol and gasoline has narrowed. In considering how the relationship between ethanol and gasoline prices affects the incentive to blend ethanol into gasoline, it is important to take account...
Continue reading
  3290 Hits

Copyright

© EIA

3290 Hits
FEB
20

Natural gas inventory exceeds five-year average for first time since November 2013

graph of daily spot prices of wholesale gasoline, ethanol, and RINS, as explained in the article text
February 20, 2015 Working natural gas in storage has surpassed five-year average levels for the first time in more than a year. At 2,157 billion cubic feet (Bcf) as of February 13, stocks are 58 Bcf greater than the five-year average. Recent extremely cold weather may result in high stock withdrawals for the week ending February 20, which could again push stocks below their five-year average. However, natural gas production in February and March that is forecast to average 5 Bcf/day above the year-ago level is likely to contribute to healthy inventories and moderate prices as the nation moves from winter into spring. At no point during 2014 did inventories surpass their five-year average; the most recent excess was on November 22, 2013. Inventories ended the 2013-14 winter withdrawal season last March at a 10-year record low of 837 Bcf . After a record injection season in 2014 (April-October), weekly working...
Continue reading
  3320 Hits

Copyright

© EIA

3320 Hits
FEB
18

Energy efficiency improvements have largely offset effect of more, larger homes

graph of factors influencing changes in residential delivered energy between 1980 and 2009, as explained in the article text
February 18, 2015 Source: U.S. Energy Information Administration, Drivers of Household Energy Consumption The growth in residential energy use has slowed to below the rate of household growth, meaning that per-household energy consumption has decreased. Analysis of EIA's Residential Energy Consumption Survey (RECS) conducted since 1980 shows how improvements in energy efficiency reduced energy intensity enough to offset more than 70% of the growth in both the number of households and the size of dwellings. Between 1980 and 2009 (the most recent survey year), delivered energy used by U.S. households increased from 9.3 quadrillion British thermal units (quads) to 10.2 quads, an average growth of 0.3% per year. The change in delivered energy during this period can be broken into component factors, including number of households, structural changes (the mix of housing types, the geographic distribution of households, and changes in average floor area), weather, and energy intensity (measured...
Continue reading
  2637 Hits

Copyright

© EIA

2637 Hits
FEB
17

Proposed efficiency standard may eliminate noncondensing gas furnaces

Graph of certified gas furnace models by efficiency rating, as explained in the article text
February 17, 2015 Republished February 17, 2015, 9:35 a.m. to clarify those involved in legal challenges to the standards. Following a court challenge that caused a previous proposal to be sent back for further analysis, the U.S. Department of Energy (DOE) has issued a new proposed rulemaking to increase the minimum efficiency standards for gas furnaces, which are mostly fueled by natural gas but also include propane furnaces. Gas furnaces are one of the largest energy consumers in the residential sector, accounting for about one-fifth of the energy delivered to homes and apartments in the United States. The proposed standard would increase the minimum efficiency standard for these furnaces for the first time since 1992. As discussed in a previous Today in Energy article , gas furnaces were one of the first products covered by federal appliance standards. The first standard, enacted by Congress in 1987 and made effective starting in...
Continue reading
  2836 Hits

Copyright

© EIA

2836 Hits
FEB
13

Shale gas and tight oil are commercially produced in just four countries

Graph of type of estimated natural gas and crude oil production in four countries in 2014, as explained in the article text
February 13, 2015 Source: U.S. Energy Information Administration calculations with data from DrillingInfo, Canadian National Energy Board, Cedigaz, Fact Global Energy China Monthly, Chevron, and Yacimientos Petroliferos Fiscales Note: Actual production from Canada through October 2014. November and December 2014 totals estimated. Canadian shale gas production total includes the Montney formation. Republished February 13, 2015, 10:30 a.m. to clarify China and Argentina's production of shale gas and tight oil, respectively. The United States, Canada, China, and Argentina are currently the only four countries in the world that are producing commercial volumes of either natural gas from shale formations (shale gas) or crude oil from tight formations (tight oil). The United States is by far the dominant producer of both shale gas and tight oil. Canada is the only other country to produce both shale gas and tight oil. China produces some small volumes of shale gas, while Argentina produces...
Continue reading
  4063 Hits

Copyright

© EIA

4063 Hits
FEB
12

Saudi Arabia budget insulated from effects of lower oil prices

Graph of Saudi Arabia budget and sovereign wealth fund, as explained in the article text
February 12, 2015 Source: U.S. Energy Information Administration, based on Bloomberg, International Monetary Fund Saudi Arabia is the largest exporter of crude oil and other petroleum liquids in the world, and their oil exports accounted for 89% of the country's total revenue in 2014. The recent decline in global oil prices is decreasing the value of these exports, leading to a potential budget shortfall. In its 2015 budget, Saudi Arabia plans to spend about $230 billion but expects to take in $190.7 billion in revenue, resulting in an overall deficit of $38.6 billion. While the oil price assumption was not specified in Saudi Arabia's budget, the budget was crafted in December 2014, when crude oil prices were between $55 and $70 dollars per barrel. In addition to having the second-largest proved oil reserves —268 billion barrels, or 16%, of the world total in 2014, behind only Venezuela's 298 billion...
Continue reading
  2983 Hits

Copyright

© EIA

2983 Hits
FEB
10

EIA tracking tool shows light-sweet crude oil imports to Gulf Coast virtually eliminated

Graph of monthly crude oil imports to the U.S. Gulf Coast by type, as explained in the article text
Graph of monthly crude oil imports to the U.S. Gulf Coast and Midwest, as explained in the article text
February 10, 2015 Source: U.S. Energy Information Administration, Crude Import Tracking Tool Note: Heavy crude has an API gravity = 35. Medium crude has an API gravity between 27 and 35. Sweet crude has 0.5% sulfur content or less. Sour crude has more than 0.5% sulfur content. The increase in U.S. shale and tight crude oil production has resulted in a decrease of crude oil imports to the U.S. Gulf Coast area, particularly for light-sweet and light-sour crude oils. These trends are visualized in EIA's crude import tracking tool , which allows for time-series analysis of crude oil imported to the United States. Historically, Gulf Coast refineries have imported as much as 1.3 million barrels per day (bbl/d) of light-sweet crude oil, more than any other region of the country. Beginning in 2010, improvements to the crude distribution system and sustained increases in production in the region (in the Permian and...
Continue reading
  3258 Hits

Copyright

© EIA

3258 Hits
FEB
09

Iraq was second-leading contributor to global oil supply growth during 2014

Graph of top five contributors to global oil supply growth in 2014, as explained in the article text
Graph of Iraq crude oil production, as explained in the article text
February 9, 2015 Source: U.S. Energy Information Administration, Short-Term Energy Outlook Despite some supply disruptions and security threats, Iraq was the second-leading contributor to global oil supply growth in 2014, behind only the United States. Iraq accounted for almost 60% of production growth among the Organization of the Petroleum Exporting Countries (OPEC), although this growth was more than offset by production declines in other OPEC countries. Iraq's crude oil production, which averaged almost 3.4 million barrels per day (bbl/d) in 2014, was 330,000 bbl/d above 2013 levels, despite the heightened security threat from the Islamic State of Iraq and the Levant (ISIL) and disrupted production in northern Iraq. Source: U.S. Energy Information Administration, Short-Term Energy Outlook, Iraq Country Analysis Brief ISIL attacks in northern Iraq in early June 2014 reduced northern Iraqi production and refinery operations (not including the Iraqi Kurdistan Region). These attacks did not affect...
Continue reading
  2851 Hits

Copyright

© EIA

2851 Hits

Proven Horsepower at ZeroRPM