MAR
20

U.S. biodiesel and renewable diesel imports decline 36% in 2014

graph of monthly U.S. biodiesel and renewable diesel imports, as explained in the article text
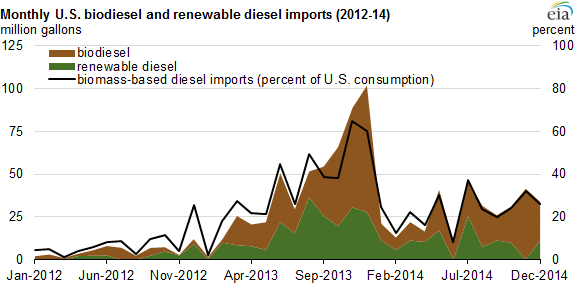
March 20, 2015 After reaching record levels in 2013 , United States imports of biomass-based diesel fuel (both biodiesel and renewable diesel) fell 36%, to 333 million gallons in 2014. Uncertainty surrounding future Renewable Fuel Standard (RFS) targets and the absence of a late-year influx of volumes from Argentina were two main factors in this decline. The strongest drivers of the resurgence in U.S. biomass-based diesel demand since 2012 have been increasing RFS targets and the on-again, off-again biodiesel tax credit. Biodiesel and renewable diesel are valuable because they qualify for the two major renewable fuel programs in the United States: the RFS applied at the national level, and California's Low Carbon Fuel Standard (LCFS). Biomass-based diesel fuels have additional advantages over other renewable fuels because of their relatively high energy content and low carbon intensity, which allow them to qualify for higher credit values in both renewable fuel programs. Both...
Continue reading
  2748 Hits

Copyright

© EIA

2748 Hits
MAR
19

U.S. commercial crude oil inventories now provide the most days of supply since 1985

graph of monthly U.S. commercial crude inventories' days of supply, as explained in the article text
graph of monthly OECD commercial crude oil inventory days of supply, as explained in the article text
March 19, 2015 Source: U.S. Energy Information Administration, Petroleum and Other Liquids and Short-Term Energy Outlook Note: U.S. crude oil inventories exclude Strategic Petroleum Reserves. December 2014 to February 2015 are estimates. With lower U.S. refinery runs and increases in domestic crude oil production, U.S. commercial crude oil inventories at the end of February provided the most days of supply since the mid-1980s. Commercial crude inventories were sufficient to supply 29 days of U.S. refinery demand, based on expected refinery runs in March. The number of days of supply is calculated by dividing the commercial crude oil inventory level at the end of the month by the forecast crude oil refinery runs in the following month. This calculation excludes government-held inventories such as the U.S. Strategic Petroleum Reserve. The days-of-supply calculation is an indicator of how loose or tight oil markets are by showing the number of days current...
Continue reading
  2873 Hits

Copyright

© EIA

2873 Hits
MAR
18

EIA launches new data add-in tool for Microsoft Excel for Windows

image of excel add-in installation, as explained in the article text
API Key
March 18, 2015 Source: U.S. Energy Information Administration The U.S. Energy Information Administration (EIA) has released a free data add-in for Microsoft Excel for Windows that builds on the well-known Federal Reserve Economic Data (FRED) add-in and allows users to find, download, and update EIA's energy data and FRED's economic data directly in any Excel spreadsheet. With this add-in, users can save spreadsheets with their favorite data series and reopen them at any time and update the data with a single click. This ability to easily access the latest available data will save time and effort for analysts performing periodic analyses of energy and economic data. The tool mirrors the functionality of the existing economic-data-only add-in provided by the St. Louis Federal Reserve Bank . Users can browse energy data categories or search keywords to find domestic and international data series, short-term forecasts, and long-term projections. A user guide...
Continue reading
  3004 Hits

Copyright

© EIA

3004 Hits
MAR
17

Falling rig counts drive projected near-term oil production decline in 3 key U.S. regions

graph of monthly oil production in selected regions, as explained in the article text
graph of ratio of vertical to horizontal wells, as explained in the article text
March 17, 2015 EIA's most recent Drilling Productivity Report (DPR) indicates a change in the crude oil production growth patterns in three key oil producing regions: the Eagle Ford, Niobrara, and Bakken . The DPR estimates, which were issued on March 9 and cover the months of March and April, include the first projected declines in crude oil production in these regions since 2009. However, with production gains continuing in other regions, particularly the Permian, overall crude oil production in regions tracked by the DPR rose slightly in March to 5.6 million barrels per day. Total production in the DPR regions in April is expected to be virtually unchanged from its March level. In any given month, there are new wells and legacy, or continuing, wells. Production from legacy wells declines over time, but recently the rate of decline in some regions has been increasing. This means that, in order for...
Continue reading
  2706 Hits

Copyright

© EIA

2706 Hits
MAR
16

Growth in residential electricity prices highest in 6 years, but expected to slow in 2015

graph of monthly average U.S. retail electricity price, as explained in the article text
graph of U.S. residential electricity price, as explained in the article text
March 16, 2015 Source: U.S. Energy Information Administration, Electric Power Monthly and Short-Term Energy Outlook Residential electricity customers in most areas of the country experienced large increases in retail electricity prices during 2014, with the average U.S. residential price increasing 3.1% over the previous year. The increase represents the highest annual growth rate since 2008. EIA forecasts that prices will increase during 2015, but at a slower pace than in 2014. Residential electricity rate increases during 2014 ranged from 1.3% in the Pacific Coast states to 9.9% in New England. Retail electricity prices have risen for various reasons. Many electric utilities purchase their power from regional wholesale electricity markets, which, at a national level, experienced higher prices last year. Other reasons commonly cited for higher retail electricity prices are the increased investment in transmission and distribution infrastructure , rising requirements to generate electricity from renewable energy sources, and utility...
Continue reading
  2738 Hits

Copyright

© EIA

2738 Hits
MAR
13

Total energy subsidies decline since 2010, with changes in support across fuel types

graph of quantified energy-specific subsidies by type, as explained in the article text
graph of quantified energy-specific subsidies and support by type, as explained in the article text
March 13, 2015 EIA has updated a report on federal subsidies to the energy industry , covering the 2013 fiscal year (FY). The most recent prior report reviewed subsidies in FY 2010, at or near the height of spending related to the American Recovery and Reinvestment Act of 2009 (more commonly known as the Recovery Act). Between FY 2010 and FY 2013, the total value of direct federal financial interventions and subsidies in energy markets decreased 23% from $38.0 billion to $29.3 billion dollars, reflecting changes in both the type of subsidies offered and fuels that received support. EIA's updated study focuses on direct federal financial interventions by the federal government that provide a financial benefit with an identifiable federal budget impact and are specifically targeted at energy markets. Within this scope are: Direct expenditures (cash payments directly to market participants) Tax expenditures (reductions in tax payments) Investment in research and...
Continue reading
  2400 Hits

Copyright

© EIA

2400 Hits
MAR
12

Oil price decline leads to lower tax revenues in top oil-producing states

graph of monthly crude oil production and tax revenues from crude oil and natural gas production from selected states, as explained in the article text
March 12, 2015 The decline in spot oil prices in the last half of 2014 and first month of 2015 has reduced oil and natural gas production tax revenues in some of the largest oil- and natural gas-producing states. Texas, North Dakota, Alaska, and Oklahoma are four of the five top oil- and natural gas-producing states, and they derive a significant share of their unrestricted operating revenues from taxes on oil and natural gas production. Although California produces more oil than both Alaska and Oklahoma, its economy is much larger, making it relatively less affected by changes in oil and natural gas prices and production. Texas collected $583 million in tax receipts from oil and natural gas production in August 2014, but tax revenue declined by 40% to $352 million in January 2015, based on data from the state's comptroller . EIA estimates crude oil and lease condensate production in Texas...
Continue reading
  2579 Hits

Copyright

© EIA

2579 Hits
MAR
11

California and Quebec complete second joint carbon dioxide emissions allowance auction

graph of settlement price of current vintage carbon dioxide allowances, as explained in the article text
March 11, 2015 California and Quebec have announced the completion of their second joint carbon dioxide (CO2) allowance auction through a cap-and-trade system . Despite geographical distance and economic differences, California and Quebec have worked to align their CO2 emissions markets and policies. Previous auctions sold emissions allowances for electric generators and large industrial sources. The most recent auction, held in February 2015, also included allowances for the transportation sector, covering wholesale gasoline suppliers. The California and Quebec program is the first international carbon allowance program to be enacted at the subnational level (i.e., between parts of two different countries). Similar programs in Europe were the first to establish markets across several countries (European Union's Emission Trading Scheme) and were also the first to cover certain transportation components. Three factors widely cited as driving expectations among participants in the joint auction are: Persistent carbon allowance surpluses in both the California and...
Continue reading
  2773 Hits

Copyright

© EIA

2773 Hits
FEB
27

Petroleum refinery outage in California highlights markets' quick price reaction

map of West Coast petroleum product supply, as explained in the article text
February 27, 2015 On February 18, an explosion and fire occurred at ExxonMobil's refinery in Torrance, California. The Torrance refinery, the third-largest refinery in Southern California, has about 20% of the region's fluid catalytic cracking capacity and is an important source of gasoline and distillate fuel oil supply for Southern California. Unplanned refinery outages can have noticeable effects on liquid fuel markets , disrupting supplies of gasoline and distillate, particularly in regions that are tightly balanced, such as the West Coast (defined as Petroleum Administration for Defense District (PADD) 5). When refineries undergo planned maintenance, they make arrangements for alternative sources of supply to ensure that obligations are met. Upcoming planned outages are examined in EIA's Refinery Outages report , released February 26. However, the sudden loss of production during unplanned outages can sometimes take days or weeks for markets to adjust. As a result, unplanned outages often result in a...
Continue reading
  2906 Hits

Copyright

© EIA

2906 Hits
FEB
26

Rise in salt cavern storage capacity for natural gas offsets declines in other capacities

graph of demonstrated maximum working gas volume, as explained in the article text
graph of working gas design capacity, as explained in the article text
February 26, 2015 With natural gas storage at low levels in most of 2014 and production relatively high, minimal new natural gas storage capacity was built, except for salt facilities in the Producing region. Capacity in the East region of the United States fell slightly, resulting in relatively unchanged national total capacity. EIA measures natural gas storage capacity in November of each year , which is typically when storage withdrawals begin to exceed storage injections. From November 2013 to November 2014, EIA found that each of EIA's two measures of storage capacity within the Lower 48 states was virtually unchanged, as increases in salt facilities largely offset declines in other types of storage capacity. The U.S. Energy Information Administration (EIA) uses two distinct measures of natural gas storage capacity: Demonstrated maximum working gas volume is the sum of peak volumes reported by the 395 active storage facilities in the Lower 48...
Continue reading
  2897 Hits

Copyright

© EIA

2897 Hits

Proven Horsepower at ZeroRPM