APR
20

U.S. energy-related carbon dioxide emissions increase in past two years

graph of crude oil and petroleum products transit through Bab el-Mandeb, as explained in the article text
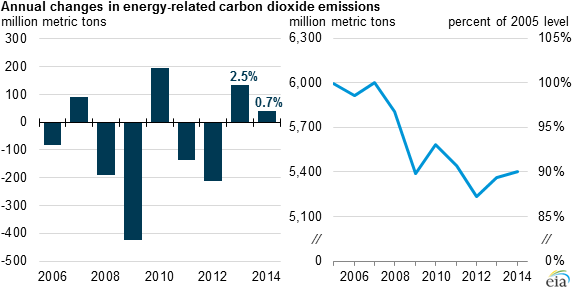
April 20, 2015 For the second year in a row, energy-related carbon dioxide (CO2) emissions in the United States have increased. However, unlike 2013, when emissions and gross domestic product (GDP) grew at similar rates (2.5% and 2.2%, respectively), 2014's CO2 emissions growth rate of 0.7% was much smaller than the 2014 GDP growth rate of 2.4%. Energy-related CO2 emissions are the largest component of overall U.S. greenhouse gas emissions. On March 31, 2015, the United States officially submitted its emissions-cutting target to the United Nations, committing to reducing U.S. greenhouse gas emissions 26%-28% from 2005 levels by 2025. This follows President Obama's 2009 pledge to reduce U.S. greenhouse gas emissions to 17% below 2005 levels by 2020. As discussed in a previous article , changes in CO2 emissions reflect changes in economic and energy-related indicators. The previous two years have largely followed the economic trends in terms of increasing population...
Continue reading
  2513 Hits

Copyright

© EIA

2513 Hits
APR
17

New maps highlight geologic characteristics of U.S. tight oil, shale plays

Map of lower 48 states shale plays, as explained in the article text
map of lower 48 states shale plays by geologic age, as explained in the article text
April 17, 2015 Source: U.S. Energy Information Administration, based on data from various published studies Note: Click to enlarge . EIA is currently in the process of updating maps of major tight oil and shale gas plays , including the Eagle Ford and Marcellus plays, which will help to better characterize the geology of key areas of production in the United States. EIA's most recent maps focus on shale and tight oil plays, and characterize plays based on geologic characteristics, including rock type and age. Understanding geologic history and processes helps exploration and production companies reduce the risk of drilling dry, nonproducing wells and better understand hydrocarbon resource potentials. Production of crude oil and natural gas occurs in two classes of rock: source rocks and reservoir rocks. Source rocks are sedimentary rocks in which hydrocarbons (organic chemical compounds of hydrogen and carbon) form. Reservoir rocks are both porous, meaning that there...
Continue reading
  3403 Hits

Copyright

© EIA

3403 Hits
APR
16

Households with more vehicles travel more

graph of average annual vehicle miles traveled per household, as explained in the article text
April 16, 2015 Based on data from the National Household Travel Survey , households with more vehicles not only travel more, but often put more miles on their most-used vehicle compared to households with fewer vehicles. Households with just one vehicle drove an average of 10,600 miles per year, while households with six or more vehicles traveled a total of 57,700 miles. Sixty-eight percent of households have either one or two cars. Households with more vehicles also tend to drive their primary (most-used) vehicle more than households with fewer vehicles. While a two-vehicle household travels almost 16,000 miles annually with the most-used vehicle, a six- (or more) vehicle household travels more than 22,000 miles annually with the most-used vehicle. The average use per vehicle within a household is greatest in a two-vehicle home, where the average vehicle travels about 11,800 miles. This average declines as the households gain more vehicles so...
Continue reading
  2858 Hits

Copyright

© EIA

2858 Hits
APR
15

U.S. energy imports and exports to come into balance for first time since 1950s

graph of U.S. net energy trade in four cases, as explained in the article text
graph of U.S. net energy trade by fuel type, as explained in the article text
April 15, 2015 Projections in EIA's Annual Energy Outlook 2015 (AEO2015), released April 14, show the potential to eliminate net U.S. energy imports sometime between 2020 and 2030. This reflects changes in both supply and demand, as continued growth in oil and natural gas production and the use of renewables combine with demand-side efficiencies to moderate demand growth. The United States has been a net importer of energy since the 1950s. The United States is currently an exporter of petroleum products and coal, but an importer of natural gas and crude oil. When the energy content of these fuels is combined, the United States in 2014 imported 23.3 quadrillion British thermal units (Btu) of energy and exported 12.2 quadrillion Btu. Projections in EIA's recently released AEO2015 show that, on an energy content basis, U.S. energy imports and exports could come into balance in coming years. The timing of the projected end...
Continue reading
  2791 Hits

Copyright

© EIA

2791 Hits
APR
14

EIA's Annual Energy Outlook will be released later today

image of AEO cover, as explained in the article text
April 14, 2015 Source: U.S. Energy Information Administration At 1:00 p.m. Eastern Time, EIA will release the Annual Energy Outlook 2015 (AEO2015), which presents long-term projections of energy supply, demand, and prices through 2040. The analysis in AEO2015 focuses on six cases: Reference, Low and High Economic Growth, Low and High Oil Price, and High Oil and Gas Resource. For the first time, the Annual Energy Outlook (AEO) is presented as a shorter edition under a newly adopted two-year release cycle. With this approach, full editions and shorter editions of the AEO will be produced in alternating years. This approach will allow EIA to focus more resources on rapidly changing energy markets both in the United States and internationally, and to consider how they might evolve over the next few years. The shorter edition of the AEO includes a limited number of model updates, predominantly to reflect historical data...
Continue reading
  2649 Hits

Copyright

© EIA

2649 Hits
APR
13

Household spending on gasoline and public transit varies by region, income

graph of selected consumer transportation expenditures by region, as explained in the article text
graph of selected consumer transportation expenditures by income (before taxes), as explained in the article text
April 13, 2015 Households in different regions of the United States have similar average combined spending on gasoline and public transit, but the composition of that spending varies significantly across regions. In 2013, the most recent year of data from the U.S. Bureau of Labor Statistics' Consumer Expenditure Survey (CES) , the average household spent $3,148 annually on gasoline and public transit, with only about a $200 difference between geographic regions with the highest and lowest travel expenditures. Differences across income levels are much greater, as households in the highest-income brackets spent almost four times as much on recurring travel expenditures as those in the lowest-income bracket. Regional differences in gasoline expenditures are almost the reverse of regional spending on public transit. The South, which stretches along the Atlantic Coast from Delaware to Florida, and west to Texas and Oklahoma, tends to spend more than any other region on gasoline each...
Continue reading
  2609 Hits

Copyright

© EIA

2609 Hits
APR
10

U.S. household gasoline expenditures expected to fall in 2015

graph of average annual household expenditures on gasoline, as explained in the article text
April 10, 2015 The average U.S. household expenditure on motor gasoline in 2015 is expected to be about $1,817, the lowest level in more than a decade. This level is about $700 less than average household gasoline expenditures in 2014. Actual spending can vary based on driving-related factors (number of vehicles, annual distance driven), some of which depend on demographic considerations (location, income, size of household). As one might expect, households with more people tend to spend more on gasoline in a year. Through its Consumer Expenditure Survey (CES), the Bureau of Labor Statistics (BLS) surveys spending of American consumer units , a term essentially equivalent to a household (i.e., people who live together and make joint expenditure decisions). Two-person households represent the highest portion of all households (about one-third in 2013) and have motor gasoline expenditures close to the average of all households. Historical data from this survey show that...
Continue reading
  2863 Hits

Copyright

© EIA

2863 Hits
APR
09

California's continued drought, reduced snowpack mean lower hydropower output

Map of California drought, as explained in the article text
Graph of California electric generation, as explained in the article text
April 9, 2015 Updated at 9:20 a.m. to include the most recent drought information from California, released this morning. Earlier this month, California Governor Jerry Brown enacted mandatory water restrictions for the first time in the state's history. While the executive order doesn't directly address hydropower generation and instead focuses on water use in cities and towns, the drought that began in 2011 has had a noticeable effect on hydropower . Furthermore, reduced levels of snowpack likely mean that hydropower output will be low throughout the summer. California's drought caused a state of emergency to be declared in January 2014. Since then, the drought has worsened, and, as of April 7, 2015 , 44% of the state is now classified as experiencing exceptional drought, the most intense drought category. The drought has limited the state's ability to generate electricity from its hydropower plants. For instance, the California Department of Water Resources...
Continue reading
  2575 Hits

Copyright

© EIA

2575 Hits
APR
08

Summer gasoline prices to be down more than $1 from last summer

graph of regular-grade gasoline retail price and summer average, as explained in the article text
April 8, 2015 Source: U.S. Energy Information Administration, Short-Term Energy Outlook U.S. drivers are projected to pay an average of $2.45/gallon (gal) for regular grade gasoline this summer (April through September), according to EIA's Short-Term Energy and Summer Fuels Outlook released yesterday. This year's projected average summer price is down from a $3.59/gal average during summer 2014. The lower retail price this summer reflects a significant drop in world crude oil prices from last summer. As the main input cost in the refining process, crude oil is the major driver of retail gasoline prices, and U.S. gasoline prices tend to follow prices of the international benchmark Brent crude. For summer 2015, the Brent crude oil spot price is projected to average $58/barrel (bbl), which translates to $1.38/gal for the crude oil portion of the gasoline price. This oil price is down from a summer 2014 average of $106/bbl ($2.52/gal...
Continue reading
  2477 Hits

Copyright

© EIA

2477 Hits
APR
07

U.S. remained world's largest producer of petroleum and natural gas hydrocarbons in 2014

graph of estimated U.S., Russia, and Saudi Arabia petroleum and natural gas production, as explained in the article text
April 7, 2015 Source: U.S. Energy Information Administration Note: Petroleum production includes crude oil, natural gas liquids, condensates, refinery processing gain, and other liquids, including biofuels. Barrels per day oil equivalent were calculated using a conversion factor of 1 barrel oil equivalent = 5.55 million British thermal units (Btu). The United States remained the world's top producer of petroleum and natural gas hydrocarbons in 2014, according to U.S. Energy Information Administration estimates. U.S. hydrocarbon production continues to exceed that of both Russia and Saudi Arabia, the second- and third-largest producers, respectively. For the United States and Russia, total petroleum and natural gas hydrocarbon production, in energy content terms, is almost evenly split between petroleum and natural gas. Saudi Arabia's production, on the other hand, heavily favors petroleum. Since 2008, U.S. petroleum production has increased by more than 11 quadrillion British thermal units (Btu), with dramatic growth in Texas and...
Continue reading
  2646 Hits

Copyright

© EIA

2646 Hits

Proven Horsepower at ZeroRPM