MAY
06

EIA’s CBECS is the nation's only comprehensive survey of commercial buildings

EIA's Commercial Buildings Energy Consumption Survey is the only nationally representative source of statistical information on energy-related characteristics, consumption, and expenditures for the nation's 5.6 million commercial buildings. Building characteristics information from the 2012 survey is being released in stages through the spring, and consumption and expenditures data will follow later in the year. Original link
  2949 Hits

Copyright

© EIA

2949 Hits
MAY
05

Crude by rail accounts for more than half of East Coast refinery supply in February

Monthly rail receipts of crude oil accounted for more than half (52%) of the crude oil supply to East Coast refineries in February. As U.S. and Canadian production of crude oil has increased, crude supply by rail to East Coast (PADD 1) refineries has grown, displacing waterborne imports of crude oil from countries other than Canada, such as Nigeria Original link
  2687 Hits

Copyright

© EIA

2687 Hits
MAY
04

Natural gas, renewables projected to provide larger shares of electricity generation

graph of electricity generation by fuel type in the AEO2015 reference case, as explained in the article text
graph of renewable electricity generation by fuel type, as explained in the article text
graph of electricity generation by fuel type in six cases, as explained in the article text
May 4, 2015 EIA's Annual Energy Outlook 2015 (AEO2015) Reference case projects that electricity consumption will increase at an average annual rate of 0.8% from 2013 to 2040, nearly in line with expected population growth. Continuing a recent trend toward lower levels of carbon-intensive generation, natural gas and renewable generation meet almost all of the increase. Electricity generation from renewable sources provided 13% of U.S. electricity in 2013. In the AEO2015 Reference case, which reflects current laws and regulations—but not pending rules, such as the Environmental Protection Agency's Clean Power Plan —this percentage is projected to increase to 18% by 2040. Wind and solar generation account for nearly two-thirds of the growth in renewable generation. Solar is the fastest-growing renewable generation source, but wind accounts for the largest absolute increase in generation. Wind becomes the single largest source of renewable generation by 2040, supplanting hydropower as the largest renewable generation source....
Continue reading
  3323 Hits

Copyright

© EIA

3323 Hits
MAY
01

Alaska residents are paid a unique yearly dividend from state's permanent fund

graph of Alaska permanent fund value and dividend, as explained in the article text
May 1, 2015 Source: U.S. Energy Information Administration, based on Alaska Department of Revenue's Permanent Fund Dividend Division Note: Dividend values reflect calendar year, and permanent fund values reflect fiscal year. The Alaska Permanent Fund, established using revenues paid to the state by oil and natural gas producers, provides Alaska residents with an annual cash dividend, which is unique among natural resource permanent funds in the United States . In 2014, the annual dividend was $1,884 per resident, more than double the 2013 dividend and the highest since 2008. All Alaska residents receive an annual cash dividend from the permanent fund. The fund was established by voters in 1976, as the extent of Alaska's oil and natural gas resources began to emerge, and retains at least 25% of the royalties that oil and natural gas producers pay to produce on leased state lands. Those royalties have provided $800 million or more...
Continue reading
  2920 Hits

Copyright

© EIA

2920 Hits
APR
30

Energy resource permanent funds vary by purpose and state

Map of lower 48 states shale plays, as explained in the article text
April 30, 2015 Source: State Treasurer's Office reports for each state as of December 31, 2014 Note: * West Virginia's fund is too new to show a measurable balance. Taxation of coal, crude oil, and natural gas production presents opportunities for states to collect revenue as nonrenewable resources are produced. Natural resource permanent funds are revenues earned from taxing the extraction of energy resources and are set aside by national, state, and local governments for strategic or long-term use. Similar to an endowment, states typically only spend the earnings and investment gains from these funds, as expenditure of principal is usually prohibited unless authorized by legislative approval or constitutional amendments. Eight states have permanent funds primarily funded by oil, coal, or natural gas tax revenues. Many of these funds also include funding from royalties and leases on public lands granted to a state by the federal government at the...
Continue reading
  2798 Hits

Copyright

© EIA

2798 Hits
APR
29

U.S. energy demand slows except for industrial, commercial sectors

graph of total energy consumption by end-use sector, as explained in the article text
April 29, 2015 U.S. energy consumption has slowed recently and is not anticipated to return to growth levels seen in the second half of the 20th century. EIA's Reference case projections in the Annual Energy Outlook 2015 (AEO2015) show that domestic consumption is expected to grow at a modest 0.3% per year through 2040, less than half the rate of population growth. Energy used in homes is essentially flat, and transportation consumption will decline slightly, meaning that energy consumption growth will be concentrated in U.S. businesses and industries. Near-zero growth in energy consumption is a recent phenomenon, and there is substantial uncertainty about the main drivers of consumption as the United States continues to recover from the latest economic recession and resumes more normal economic growth. EIA's analysis in the AEO2015 includes several cases with various assumptions about macroeconomic growth, world oil prices, and domestic energy resource availability. Increases in energy...
Continue reading
  2649 Hits

Copyright

© EIA

2649 Hits
APR
28

Projections show U.S. becoming a net exporter of natural gas

graph of U.S. net natural gas trade, as explained in the article text
graph of U.S. net natural gas trade in four cases, as explained in the article text
April 28, 2015 Republished April 28, 2015, 11:00 a.m., to correct an error in the text. In its recently released Annual Energy Outlook 2015 (AEO2015), EIA expects the United States to be a net natural gas exporter by 2017. After 2017, natural gas trade is driven largely by the availability of natural gas resources and by world energy prices. Increased availability of domestic gas or higher world energy prices each increase the gap between the cost of U.S. natural gas and world prices that encourages exports of liquefied natural gas (LNG), and, to a lesser extent, greater exports by pipeline to Mexico. The AEO2015 examines alternate cases with higher and lower world oil price assumptions, which serve as a proxy for broader world energy prices given oil-indexed contracts, as well as with higher assumed U.S. oil and natural gas resources. These assumptions significantly affect projected growth in annual net LNG exports...
Continue reading
  2794 Hits

Copyright

© EIA

2794 Hits
APR
27

Floating LNG regasification is used to meet rising natural gas demand in smaller markets

graph of total global LNG regasification capacity, as explained in the article text
graph of floating LNG regasification capacity by region, as explained in the article text
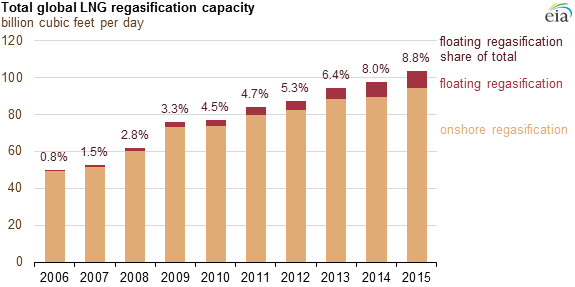
April 27, 2015 Floating regasification is a flexible, cost-effective way to receive and process shipments of liquefied natural gas (LNG). Floating regasification is increasingly being used to meet natural gas demand in smaller markets, or as a temporary solution until onshore regasification facilities are built. Of four countries planning to begin importing LNG in 2015, three of them—Pakistan, Jordan, and Egypt—have chosen to do so using floating regasification rather than building full-scale onshore regasification facilities. Floating regasification involves the use of a specialized vessel called a floating storage and regasification unit (FSRU), which is capable of transporting, storing, and regasifying LNG onboard. Floating regasification also requires either an offshore terminal, which typically includes a buoy and connecting undersea pipelines to transport regasified LNG to shore, or an onshore dockside receiving terminal. An FSRU can be purpose-built or be converted from a conventional LNG vessel. Floating regasification offers a flexible, cost-effective solution...
Continue reading
  2726 Hits

Copyright

© EIA

2726 Hits
APR
24

EIA report highlights top 100 U.S. oil and natural gas fields

maps of top 100 U.S. oil and natural gas fields by reserves, as explained in the article text
map of top 100 U.S. oil fields by reserves, as explained in the article text
map of top 100 U.S. natural gas fields by reserves, as explained in the article text
April 24, 2015 Source: U.S. Energy Information Administration, based on Form EIA-23L and DrillingInfo Note: The top 100 largest oil and natural gas field locations are plotted using latitude-longitude of the approximate center of the field. Dot diameter is relative to its 2013 proved reserves. The top 100 oil fields in the United States accounted for 20.6 billion barrels of crude oil and lease condensate proved reserves, or 56% of the U.S. total in 2013. The top 100 natural gas fields accounted for 239.7 trillion cubic feet of natural gas proved reserves, 68% of the U.S. total. Proved reserves are defined as estimated quantities of oil and natural gas that analysis of geologic and engineering data demonstrates with reasonable certainty are recoverable under existing economic and operating conditions. Source: U.S. Energy Information Administration, based on Form EIA-23L and DrillingInfo Note: The top 100 largest oil and natural gas field...
Continue reading
  3858 Hits

Copyright

© EIA

3858 Hits
APR
21

Increasing domestic production of crude oil reduces net petroleum imports

graph of U.S. crude oil production and net petroleum trade as a percent of U.S. petroleum product supplied, as explained in the article text
graph of U.S. net crude oil imports and U.S. net petroleum product imports, as explained in the article text
April 21, 2015 In its recently released Annual Energy Outlook 2015 (AEO2015) Reference case, EIA expects U.S. crude oil production to rise through 2020 as oil prices recover from their steep decline, reducing net petroleum (crude oil and petroleum products) imports. AEO 2015 explores the effects of domestic crude oil production under various assumptions about world oil prices and domestic resource availability. In all AEO2015 scenarios, the United States remains a net importer of crude oil (despite increased domestic production) and a net exporter of petroleum products. As always with EIA base-case outlooks, AEO2015 assumes no changes in current laws and regulations. Thus, all cases in the AEO2015 assume that current restrictions on U.S. crude oil exports remain in place. Increasing levels of domestic crude oil production through 2020 have two effects: lower crude oil imports and higher throughput at U.S. refineries. Higher refinery throughput increases production and net exports of...
Continue reading
  2811 Hits

Copyright

© EIA

2811 Hits

Proven Horsepower at ZeroRPM