OCT
27

Increasing ethanol use has reduced the average energy content of retail motor gasoline

graph of oxygenate content of gasoline and energy content of gasoline, as explained in the article text
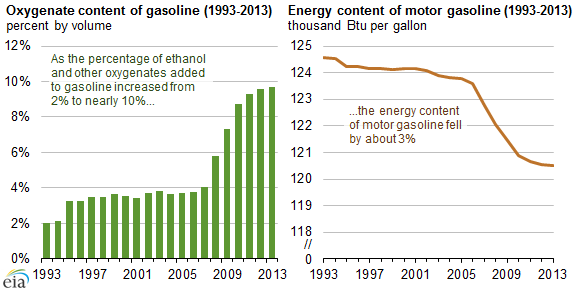
October 27, 2014 Source: U.S. Energy Information Administration, Monthly Energy Review EIA has adjusted its estimates of the energy content of retail motor gasoline in the Monthly Energy Review (MER) to reflect its changing composition. Ethanol and other oxygenates, which have lower energy content than petroleum-based gasoline components, have seen their share of total gasoline volumes increase from 2% in 1993 to nearly 10% in 2013. As a result, EIA's estimate of motor gasoline's average energy content per gallon has declined by about 3% over this 20-year period. The adjustment in EIA's estimate of the average energy content per gallon of motor gasoline reflects changes in response to 1990 Clean Air Act (CAA) regulations that split the U.S. gasoline market into three segments: conventional, oxygenated, and reformulated . Oxygenated and reformulated gasoline was required to be blended with compounds that contained oxygen, such as MTBE (methyl tert-butyl ether) or...
Continue reading
  2693 Hits

Copyright

© EIA

2693 Hits
OCT
24

Electricity distribution investments rose over the past two decades

Investment by U.S. investor-owned utilities in the electricity distribution system has increased over the past two decades. While down from a peak of $20 billion in 2012, 2013 levels remain higher than spending in the 1990s and early 2000s. Increased investment in the electricity distribution system has occurred even as U.S. electricity sales have decreased.
Continue reading
  2676 Hits
2676 Hits
OCT
24

Electricity distribution investments rose over the past two decades

graph of electricity distribution system additions in the U.S., as explained in the article text
October 24, 2014 Source: U.S. Energy Information Administration, from the Federal Energy Regulatory Commission Investment by U.S. investor-owned utilities in the electricity distribution system has increased over the past two decades. While down from a peak of $20 billion in 2012, 2013 levels remain higher than spending in the 1990s and early 2000s. Increased investment in the electricity distribution system has occurred even as U.S. electricity sales have decreased . Electricity distribution systems differ from transmission systems, which have also experienced increased investment over the past two decades . Transmission systems consist of the infrastructure necessary to deliver electricity from power plants to substations located near demand centers. Components of the transmission system are rated for higher voltages than the distribution system that delivers electricity to end users. The electricity distribution system consists of lines, substations, and transformers that lower the voltage to levels required for customers such as...
Continue reading
  3036 Hits

Copyright

© EIA

3036 Hits
OCT
23

Lower electricity-related CO2 emissions reflect lower carbon intensity and electricity use

U.S. energy-related carbon dioxide emissions (CO2) have declined in five of the past eight years. This trend has been led by emissions reductions in the electric power sector. Electricity demand growth has been lower than in the past and at the same time the power sector has become less carbon intensive (measured as CO2 emitted per kilowatthour of generation). Total emissions from the electric power sector in 2013 totaled 2,053 million metric tons (MMmt), about 15% below their 2005 level.
Continue reading
  2519 Hits
2519 Hits
OCT
22

Weather-driven energy intensity increase led to higher energy-related emissions in 2013

U.S. energy-related carbon dioxide emissions increased in 2013 by 129 million metric tons (2.5%), the largest increase since 2010 and the fourth-largest increase since 1990. Emissions trends reflect a combination of economic factors (population multiplied by per capita output [GDP/population]), energy intensity (energy use per dollar of GDP), and carbon intensity (carbon emissions per unit of energy consumed).
Continue reading
  2659 Hits
2659 Hits
OCT
21

Consumer energy expenditures are roughly 5% of disposable income, below long-term average

Total U.S. household energy consumption expenditures have generally declined relative to disposable income since 1960, although during periods of high energy prices, consumers devote increasing shares of their income to energy. Energy expenditures ranged from 4% to 8% of disposable income since 1960. Consumer energy expenditures today are a lower percentage of disposable income than the average from 1960 to present.
Continue reading
  2517 Hits
2517 Hits
OCT
20

North Dakota aims to reduce natural gas flaring

About one-third of the natural gas North Dakota has produced in recent years has been flared rather than sold to customers or consumed on-site. In an effort to reduce the amount of natural gas flared, North Dakota's Industrial Commission (NDIC) established targets that decrease flared gas to 10% by 2020.
Continue reading
  2608 Hits
2608 Hits
OCT
17

Energy for growing and harvesting crops is a large component of farm operating costs

The U.S. agriculture industry used nearly 800 trillion British thermal units (Btu) of energy in 2012, or about as much primary energy as the entire state of Utah. Agricultural energy consumption includes energy needed to grow and harvest crops and energy needed to grow livestock. Crop operations consume much more energy than livestock operations, and energy expenditures for crops account for a higher percentage of farm operating costs
Continue reading
  2692 Hits
2692 Hits
OCT
16

EIA launches expanded winter heating fuels data program for winter 2014-15

EIA is expanding the State Heating Oil and Propane Program (SHOPP) this winter heating season. SHOPP is a joint effort between EIA and participating states to collect weekly residential heating oil and propane price data. The SHOPP program has traditionally included 24 states in the Northeast and Midwest regions, but the program was expanded after many other states expressed interest in the program following the winter of 2013-14.
Continue reading
  2653 Hits
2653 Hits
OCT
15

Some Appalachian natural gas spot prices are well below the Henry Hub national benchmark

Some natural gas prices at trading hubs in the Appalachian Basin's Marcellus Shale play are trading well below the national benchmark spot price at the Henry Hub in Louisiana. Over the past month, spot prices at many Appalachian hubs have dropped below $2 per million British thermal units (MMBtu) on days of low demand, while spot prices at Henry Hub and throughout much of the United States have traded near $4/MMBtu.
Continue reading
  2823 Hits
2823 Hits

Proven Horsepower at ZeroRPM