APR
01

Updated geologic maps provide greater detail for Marcellus formation

structure map of the Marcellus formation, as explained in the article text
3d image of the Marcellus formation, Appalachian Basin, as explained in the article text
thickness map of the Marcellus formation, as explained in the article text
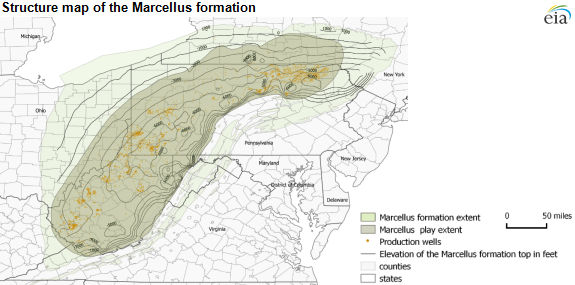
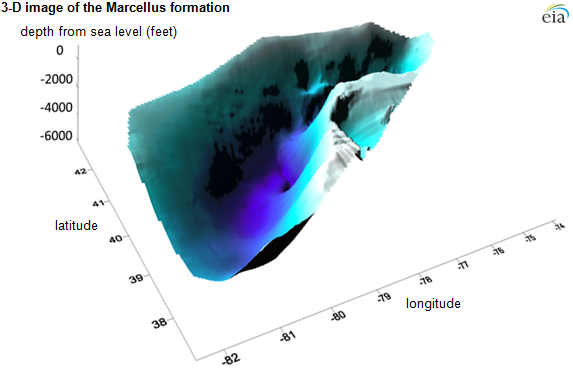
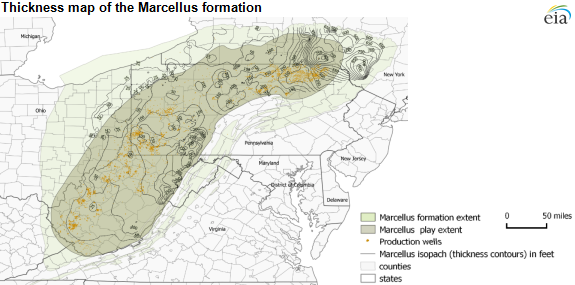
April 1, 2015 Source: U.S. Energy Information Administration, based on DrillingInfo Inc., New York State Geological Survey, Ohio State Geological Survey, Pennsylvania Bureau of Topographic & Geologic Survey, West Virginia Geological & Economic Survey, and U.S. Geological Survey Note: Map includes production wells from January 2003 through December 2014. Click to enlarge . Natural gas production from the Marcellus shale formation in the Appalachian basin increased to 14.4 billion cubic feet per day (Bcf/d) in January 2015, accounting for more than 36% of shale gas production and more than 18% of total dry natural gas production in the United States, according to EIA's Natural Gas Weekly Update . Recent updates to EIA's maps and geologic information for the Marcellus shale play help to characterize the formation's structure, thickness, and extent. EIA uses well data to construct maps showing the formation extent and structure of the productive and prospectively productive regions of...
Continue reading
  6893 Hits
6893 Hits
MAR
31

Obama to Offer Major Blueprint on Climate Change

The president’s plan, likely to draw opposition from Republicans, would cut greenhouse gas emissions in the United States 26 to 28 percent by 2025. Original link Original author: CORAL
  4435 Hits
4435 Hits
MAR
31

Gas Utilities Reduce Leaks of Methane, Study Finds

Researchers suggested that the reduction was largely a result of equipment upgrades, including replacement of leaky old cast-iron or unprotected steel pipe. Original link Original author: JOHN
  3914 Hits
3914 Hits
MAR
31

How Standing Idle is Setting You Back

Pop quiz: Which uses more fuel and produces more emissions – letting a passenger car idle for 15 seconds or turning off a car and restarting it after 15 seconds? If you answered that restarting the car uses more fuel, you would not be alone. Most people believe that starting is the less efficient option. But that’s not the case, according to research conducted by Argonne National Laboratory. Results of their experiment revealed that just 10 seconds of passenger car idling time actually uses more fuel than stopping and restarting the engine. All of the fuel used during engine idling adds up to a real bottom-line impact. The U.S. Department of Energy estimates that Americans waste about 6 billion gallons of gas every year. How many of those gallons are a result of vehicles in your fleet needlessly idling, and how much is it impacting your fuel expense costs? The good...
Continue reading
  7735 Hits
7735 Hits
MAR
31

New EIA monthly data tracks crude oil movements by rail

map of crude-by-rail movements, as described in the article text
Source: U.S. Energy Information Administration based on data from the Surface Transportation Board and other information Note: Crude-by-rail movements greater than 1,000 barrels per day are represented on the map; short-distance movements between rail yards within a region are excluded. PADD denotes Petroleum Administration for Defense District. For the first time, EIA is providing monthly data on rail movements of crude oil, which have significantly increased over the past five years. The new data on crude-by-rail (CBR) movements are integrated with EIA's existing monthly petroleum supply statistics, which already include movements by pipeline, tanker, and barge. The new monthly time series of crude oil rail movements includes shipments to and from Canada and dramatically reduces the absolute level of unaccounted for volumes in EIA's monthly balances for each region. EIA is initiating the new series with monthly data from January 2010 through the current reporting month, January 2015. CBR...
Continue reading
  6019 Hits
6019 Hits
MAR
30

Climate Change Threatens to Kill Off More Aspen Forests by 2050s, Scientists Say


Scientists warned that the aspen forests could be doomed if emissions of greenhouse gases continue at a high level, adding to other studies that suggest the global effect of climate change. Original link Original author: JUSTIN
  3968 Hits
3968 Hits
MAR
30

U.S. oil production growth in 2014 was largest in more than 100 years

graph of annual change in U.S. field production of crude oil, as explained in the article text
March 30, 2015 Source: U.S. Energy Information Administration, Petroleum Supply Monthly U.S. crude oil production (including lease condensate) increased during 2014 by 1.2 million barrels per day (bbl/d) to 8.7 million bbl/d, the largest volume increase since recordkeeping began in 1900. On a percentage basis, output in 2014 increased by 16.2%, the highest growth rate since 1940. Most of the increase during 2014 came from tight oil plays in North Dakota, Texas, and New Mexico where hydraulic fracturing and horizontal drilling were used to produce oil from shale formations. In percentage terms, the 2014 increase is the largest in more than six decades. Annual increases in crude oil production regularly surpassed 15% in the first half of the 20th century, but those changes were relatively less in absolute terms because production levels were much lower than they are now. Crude oil production in the United States has increased in...
Continue reading
  3797 Hits
3797 Hits
MAR
28

How Idealism, Expressed in Concrete Steps, Can Fight Climate Change


Where global warming conferences and protocols have largely failed, economics and personal choices might solve a seemingly intractable problem. Original link Original author: ROBERT
  3778 Hits
3778 Hits
MAR
27

Without the Cochin pipeline, western Canadian propane seeks new outlets

graph of monthly propane imports from Western Canada, as explained in the article text
map of U.S. customs and border patrol port of entry for propane shipments on Cochin pipeline, as explained in the article text
graph of Canadian propane inventories, as explained in the article text
graph of monthly average spot propane prices and Conway minus Edmonton spread, as explained in the article text
March 27, 2015 Source: U.S. Energy Information Administration, Form EIA-814 Republished March 27, 2015, 10:15 a.m., graph was corrected. In April 2014, after 35 years of shipping propane from western Canada to the upper Midwest, the Cochin pipeline was removed from propane service, and in July repurposed to ship light petroleum liquids north from Illinois to western Canada . Without this pipeline, western Canadian propane production has been shipped by other existing transport modes or placed into inventory at Canadian storage facilities. Recently, the declining value of western Canadian propane has encouraged the development of projects to provide additional outlets for growing production. Prior to its removal from propane service, the Cochin pipeline provided an effective outlet for western Canadian propane production. EIA tracks imports of propane by port of entry. Historically, propane imported from Canada on the Cochin pipeline had been reported at one of three border crossings into North...
Continue reading
  4181 Hits
4181 Hits
MAR
26

U.S. ethanol exports in 2014 reach highest level since 2011

graph of annual U.S. exports of fuel ethanol, as explained in the article text
March 26, 2015 Source: U.S. Energy Information Administration, Petroleum Supply Monthly According to EIA monthly supply data through December 2014, which EIA released in late February, U.S. exports of fuel ethanol in 2014 reached their second-highest level at a total of 826 million gallons. This level was second only to the 1.2 billion gallons exported during 2011 and 33% more than exports of fuel ethanol in 2013. Similarly, U.S. imports of ethanol, which totaled approximately 377 million gallons during 2013 , fell by 81% to a total of 73 million gallons in 2014, their lowest annual level since 2010. As a result, the United States was a net exporter of fuel ethanol for the fifth consecutive year and exported the fuel to 37 different countries in 2014. In the United States, ethanol is primarily used as a blending component in the production of motor gasoline (mainly blended in volumes...
Continue reading
  3629 Hits
3629 Hits

Proven Horsepower at ZeroRPM